High-Low Method Calculator
Quickly separate mixed costs into fixed and variable components using your highest and lowest activity data points.

How High-Low Method Calculator Works
The high-low method is a straightforward cost accounting technique that helps businesses understand how their costs behave at different activity levels. It takes your highest and lowest production or activity periods and uses those two data points to calculate how much of your total cost stays constant (fixed costs) versus how much changes with production volume (variable costs).
Here's how it works: You identify the period with your highest activity level and the period with your lowest activity level, along with their corresponding total costs. The method calculates the variable cost per unit by dividing the difference in costs by the difference in activity levels. Once you know the variable cost per unit, you can determine your fixed costs by subtracting the variable portion from your total costs.
This method is particularly useful for budgeting, pricing decisions, and understanding your cost structure without needing complex statistical analysis. While it's simpler than regression analysis and only uses two data points, it provides a quick estimate that's often sufficient for preliminary analysis or when detailed cost data is limited.
High-Low Method Calculator Formula Breakdown
Formula
Variable cost per unit = (High activity cost - Low activity cost) ÷ (High activity level - Low activity level)
Fixed cost = Total cost - (Variable cost per unit × Activity level)
Variables Explained
- High activity level costThe total cost during your period of highest production or activity. This should include all costs incurred during your busiest operational period, typically found in monthly or quarterly financial reports.
- High activity levelThe number of units, hours, or other activity measure during your highest production period. This could be units produced, hours worked, customers served, or any other relevant volume metric that drives your costs.
- Low activity level costThe total cost during your period of lowest production or activity. This represents all costs incurred during your slowest operational period, helping establish the baseline cost behavior pattern.
- Low activity levelThe number of units, hours, or other activity measure during your lowest production period. This should correspond to the same time frame and measurement unit as your high activity level for accurate comparison.
Example Calculation
Given:
- High activity level cost: $50,000
- High activity level: 10,000 units
- Low activity level cost: $35,000
- Low activity level: 5,000 units
Calculation:
Variable cost per unit: ($50,000 - $35,000) ÷ (10,000 - 5,000) = $15,000 ÷ 5,000 = $3.00
Fixed cost: $50,000 - ($3.00 × 10,000) = $50,000 - $30,000 = $20,000
Result:
Variable cost: $3.00/unit, Total fixed cost: $20,000Explanation
This example represents a manufacturing company comparing their busiest month (10,000 units produced at $50,000 total cost) with their slowest month (5,000 units at $35,000 total cost). The analysis reveals that each additional unit costs $3.00 to produce, while fixed costs like rent and salaries total $20,000 regardless of production volume.
Tips for Using High-Low Method Calculator
- 💡Ensure your high and low data points represent normal operations, not unusual circumstances like equipment breakdowns or seasonal anomalies that could skew your cost analysis.
- 💡Use data from the same time period length (months, quarters) and verify that the activity levels actually drove the costs rather than being coincidental.
- 💡Consider using this method as a starting point before moving to more sophisticated regression analysis, especially if you have limited historical data or need quick estimates.
See How Businesses Use Calculators Like This
Order Forms
Customers want a price now, not a consultation call. Every reply-all is another chance for them to ghost you. Interactive order forms with instant pricing and Stripe payments turn browsers into buyers on the spot.
Pricing Calculators
Half of B2B buyers eliminate vendors who hide pricing. Your sales reps waste hours quoting in spreadsheets. Interactive pricing calculators let prospects configure, compare, and self-qualify — 24/7.
Marketing Calculators
Your ebooks get downloaded and never opened. Your blog gets traffic but zero leads. ROI, ROAS, and ad spend calculators give visitors personalized answers — and give your sales team their budget, goals, and contact info.
ROI Calculators
Your champion loves the product but the CFO kills the deal because there's no business case. ROI and TCO calculators let prospects prove the math with their own numbers — and hand your sales team a signed business case.
Make Your Own Web Calculator in 3 Simple Steps
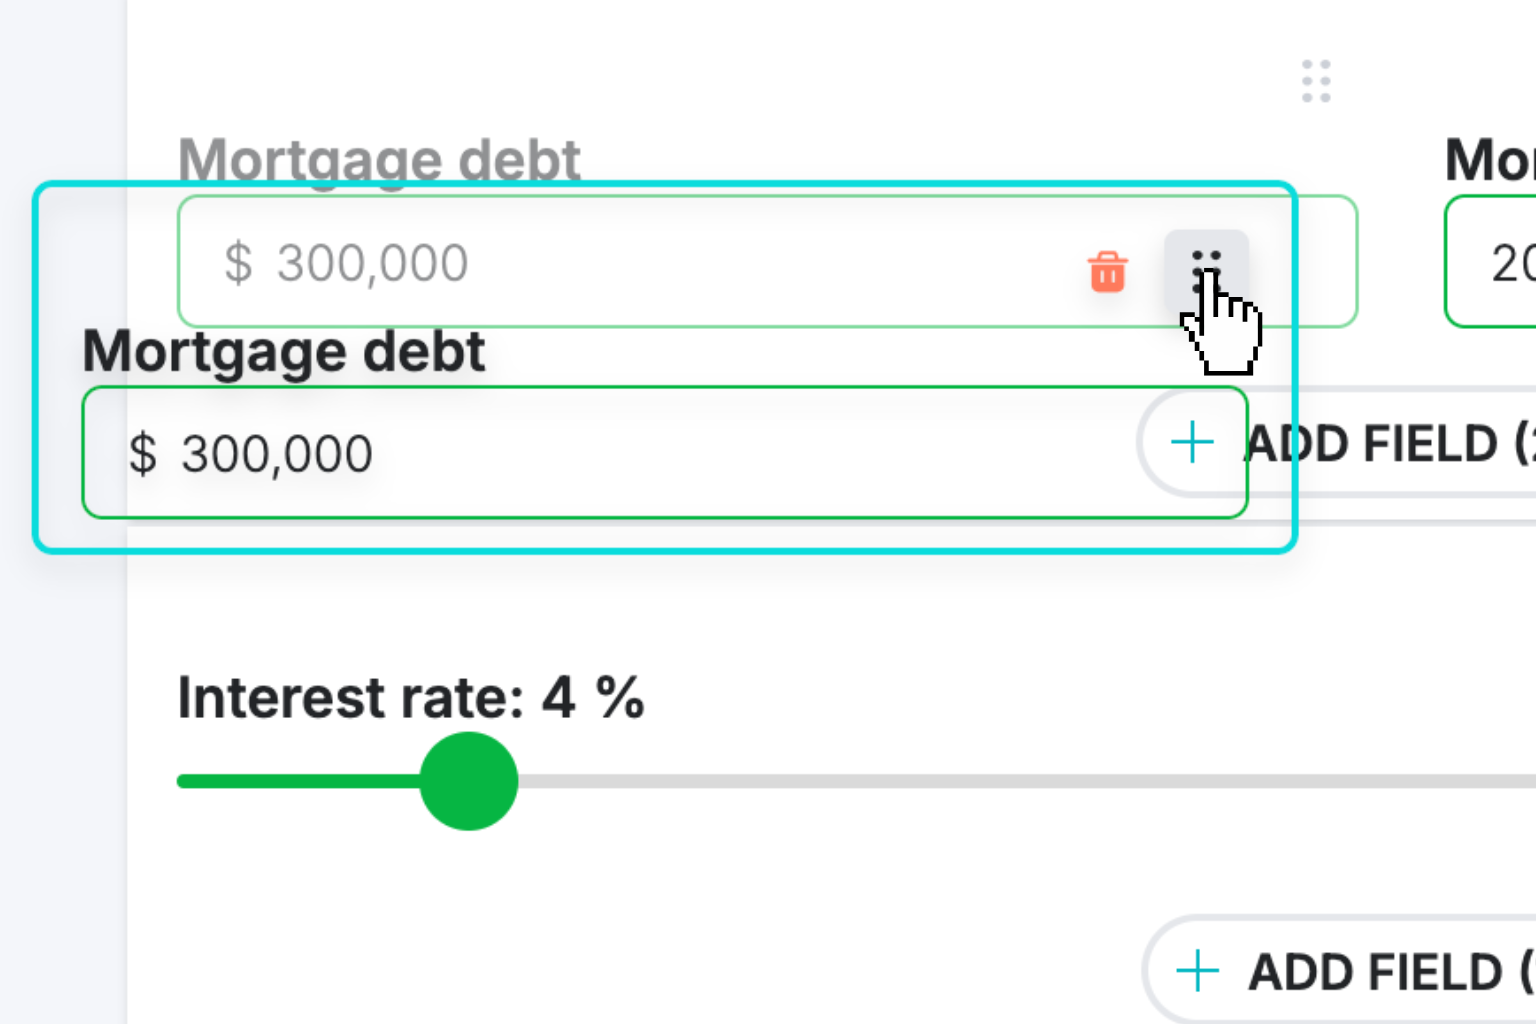
Create Interactive Calculator
Design your interactive calculator in under 5 minutes using our drag-and-drop builder.
Preview & Generate Embed Code
Review your calculator and copy the embed script when you're satisfied with the results.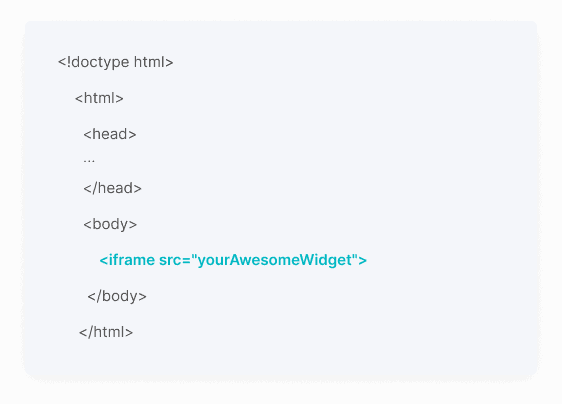
Embed Calculator Into Your Website
Paste the code into your website's HTML. Works on WordPress, Shopify, Wix, and any platform.Works With Any Platform
 EugenCreator of Creative Widgets
“After 10+ years in digital marketing, I’ve built calculators that drove thousands of new leads for clients. I realized one thing: calculators convert. They're killer for CRO and great for SEO. That's why I built Creative Widgets—an easy, no-code calculator builder. ”
It's free. Try it out. You'll like it.