Degree of Operating Leverage (DOL) Calculator
Quickly measure how sensitive your company's profits are to sales changes with operating leverage analysis.

How Degree of Operating Leverage (DOL) Calculator Works
The Degree of Operating Leverage (DOL) measures how much your company's operating income will change when sales fluctuate. It's calculated by comparing the percentage change in EBIT (operating income) to the percentage change in sales between two periods.
Companies with high fixed costs typically have higher DOL values, meaning small sales increases can lead to dramatic profit jumps. This magnifying effect works both ways - during sales declines, profits can drop sharply too.
DOL is essential for understanding operational risk and planning business strategy. Manufacturing companies often have higher DOL than service businesses due to equipment, facilities, and other fixed expenses that don't change with sales volume.
This metric helps investors, managers, and lenders assess how volatile a company's earnings might be during economic changes. A DOL of 2.5 means a 10% sales increase would boost operating income by 25%.
Degree of Operating Leverage (DOL) Calculator Formula Breakdown
Formula
DOL = (Percentage change in EBIT) ÷ (Percentage change in sales)
Percentage change in EBIT = ((Current period EBIT - Previous period EBIT) ÷ Previous period EBIT) × 100
Percentage change in sales = ((Current period sales - Previous period sales) ÷ Previous period sales) × 100
Variables Explained
- Previous period salesTotal revenue from the earlier time period being compared, typically from the prior year or quarter. This baseline figure comes from your income statement and should represent the same business scope as your current period.
- Previous period EBITEarnings Before Interest and Taxes from the earlier period, also called operating income. This shows profit from core operations before financing costs and taxes, found on your income statement below operating expenses.
- Current period salesTotal revenue from the more recent time period being analyzed. Use the same accounting methods and business scope as the previous period to ensure accurate comparison of operational performance.
- Current period EBITOperating income for the current period, calculated as revenue minus all operating expenses but before interest and taxes. This reflects how efficiently your core business operations generated profit during this timeframe.
Example Calculation
Given:
- Previous period sales: $200,000
- Previous period EBIT: $20,000
- Current period sales: $250,000
- Current period EBIT: $50,000
Calculation:
EBIT change: ($50,000 - $20,000) ÷ $20,000 = $30,000 ÷ $20,000 = 1.50 = 150.00%
Sales change: ($250,000 - $200,000) ÷ $200,000 = $50,000 ÷ $200,000 = 0.25 = 25.00%
DOL = 150.00% ÷ 25.00% = 6.00
Result:
6.00Explanation
This example shows a company that increased sales by 25% but saw operating income jump by 150%, resulting in a DOL of 6.00. This high leverage means the business has significant fixed costs, so sales growth translates into disproportionately large profit increases.
Tips for Using Degree of Operating Leverage (DOL) Calculator
- 💡Use periods of similar length and ensure both periods represent normal business operations - avoid comparing periods affected by one-time events or seasonal anomalies for more meaningful results.
- 💡Companies with DOL above 1.5 face higher operational risk, meaning earnings can swing dramatically with sales changes - this is crucial information for budgeting and investment decisions.
- 💡DOL varies significantly by industry: manufacturing and capital-intensive businesses typically show higher values (2-4) while service companies often have lower DOL (1-2) due to fewer fixed costs.
See How Businesses Use Calculators Like This
Order Forms
Customers want a price now, not a consultation call. Every reply-all is another chance for them to ghost you. Interactive order forms with instant pricing and Stripe payments turn browsers into buyers on the spot.
Pricing Calculators
Half of B2B buyers eliminate vendors who hide pricing. Your sales reps waste hours quoting in spreadsheets. Interactive pricing calculators let prospects configure, compare, and self-qualify — 24/7.
Marketing Calculators
Your ebooks get downloaded and never opened. Your blog gets traffic but zero leads. ROI, ROAS, and ad spend calculators give visitors personalized answers — and give your sales team their budget, goals, and contact info.
ROI Calculators
Your champion loves the product but the CFO kills the deal because there's no business case. ROI and TCO calculators let prospects prove the math with their own numbers — and hand your sales team a signed business case.
Make Your Own Web Calculator in 3 Simple Steps
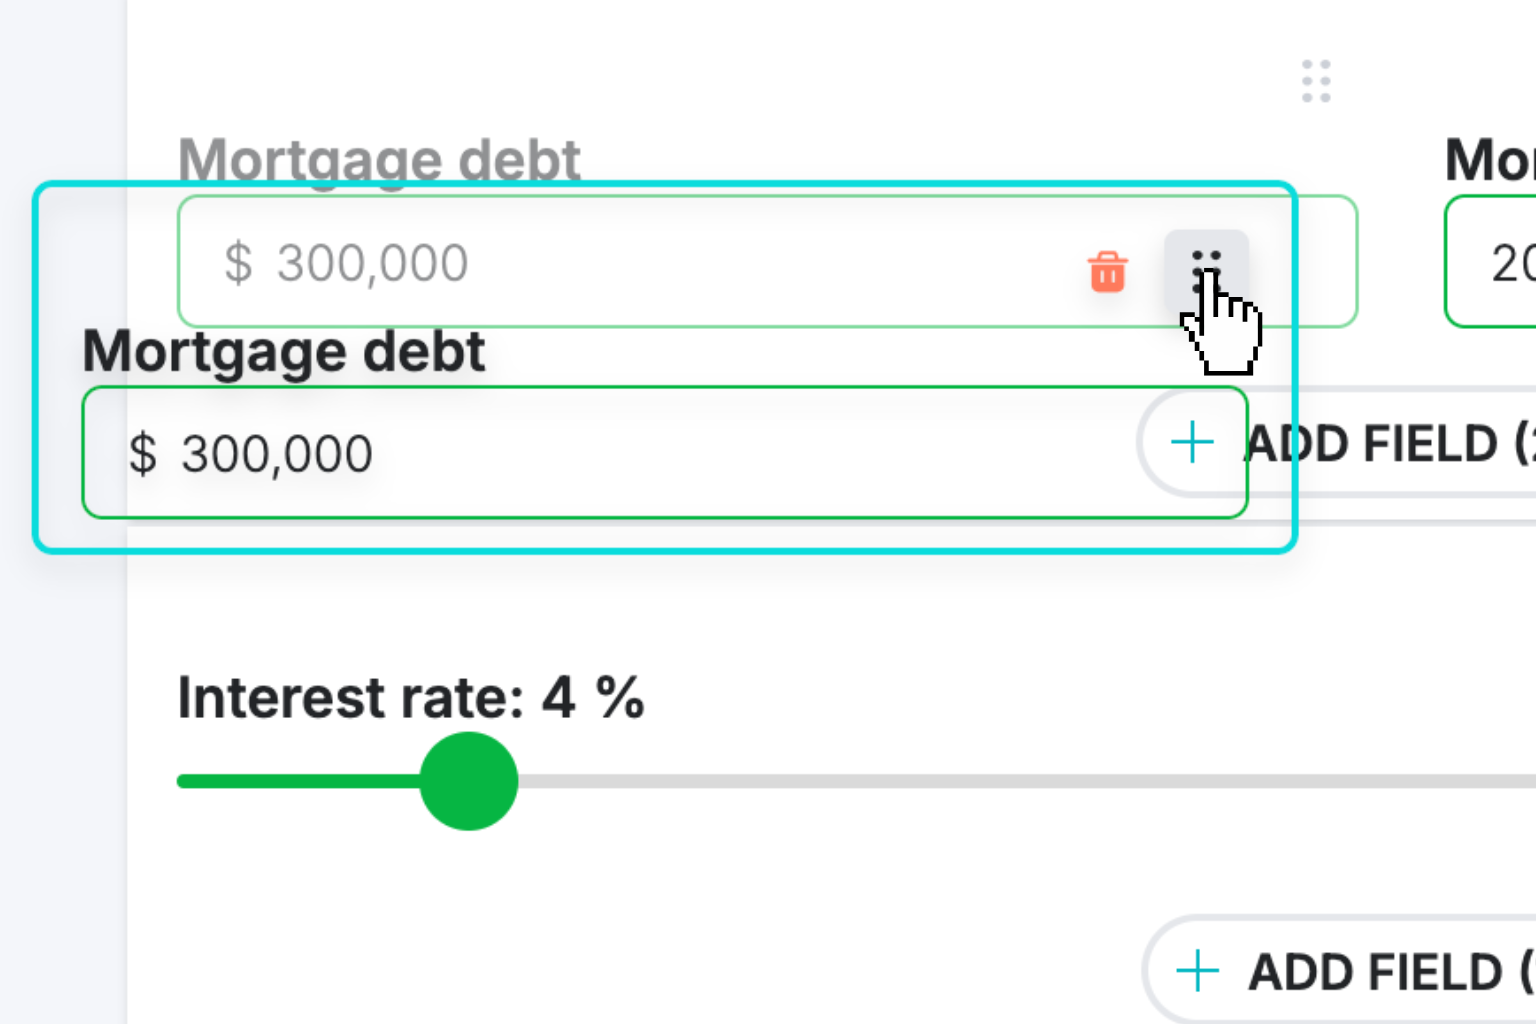
Create Interactive Calculator
Design your interactive calculator in under 5 minutes using our drag-and-drop builder.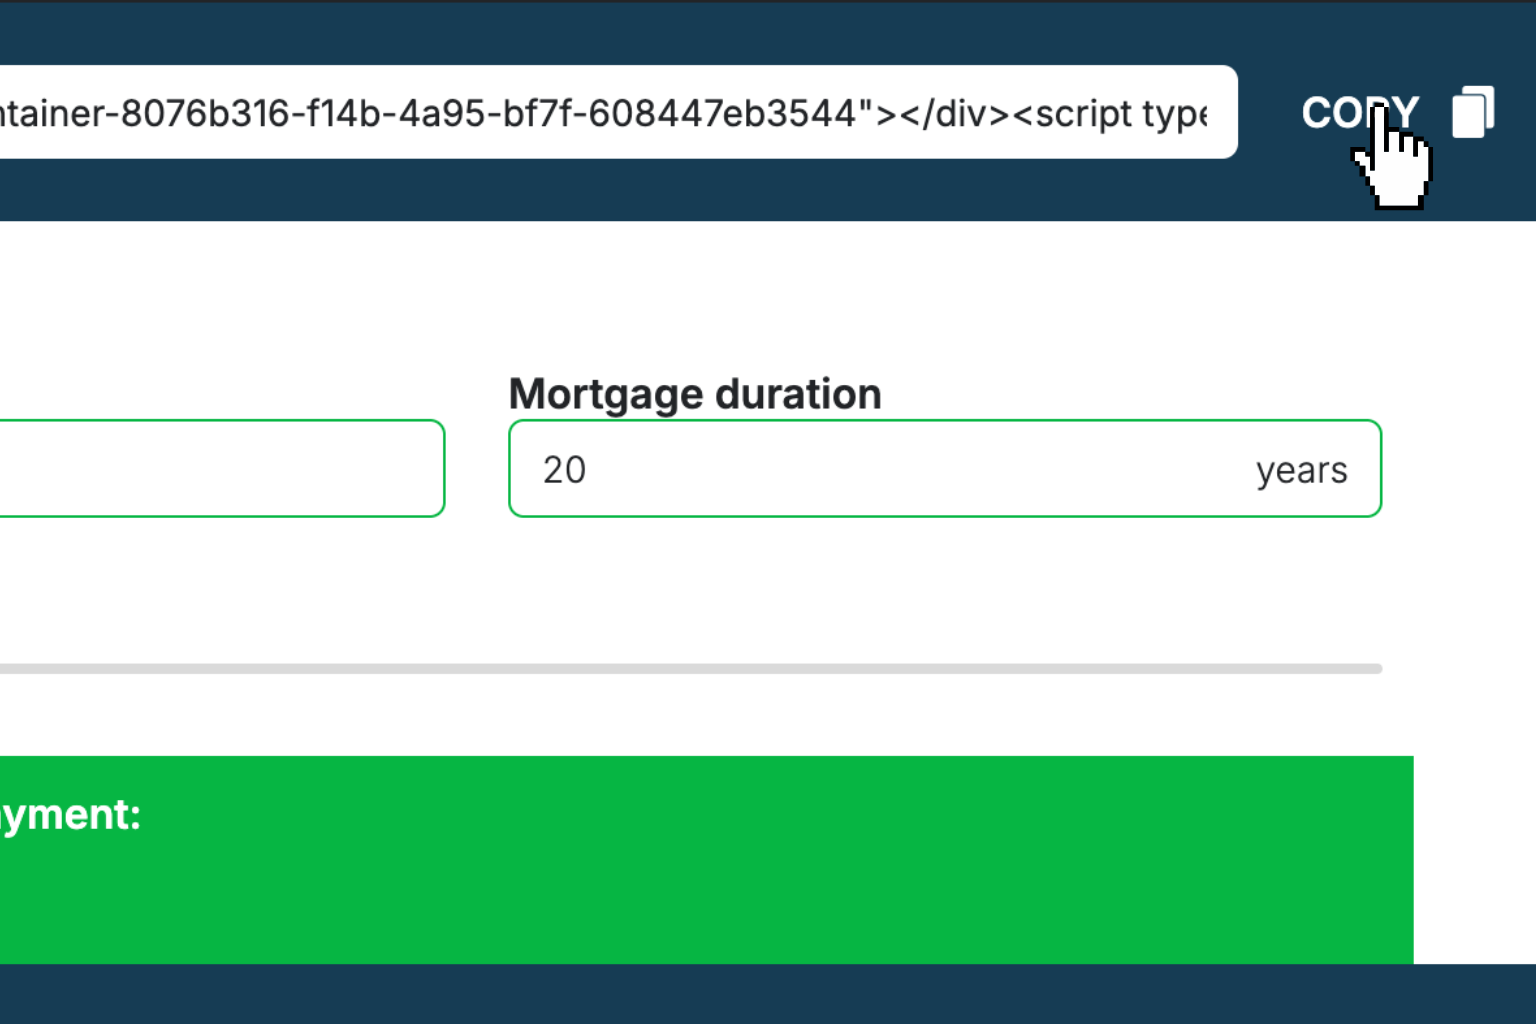
Preview & Generate Embed Code
Review your calculator and copy the embed script when you're satisfied with the results.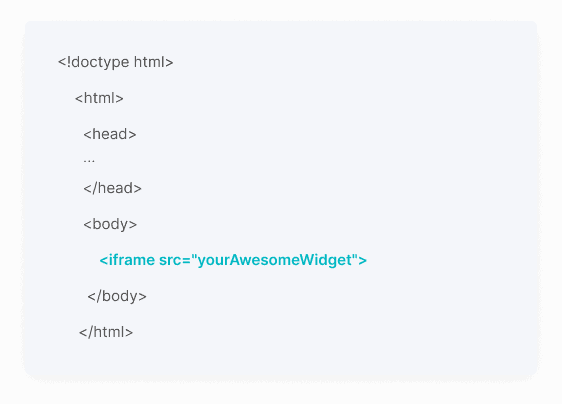
Embed Calculator Into Your Website
Paste the code into your website's HTML. Works on WordPress, Shopify, Wix, and any platform.Works With Any Platform
 EugenCreator of Creative Widgets
“After 10+ years in digital marketing, I’ve built calculators that drove thousands of new leads for clients. I realized one thing: calculators convert. They're killer for CRO and great for SEO. That's why I built Creative Widgets—an easy, no-code calculator builder. ”
It's free. Try it out. You'll like it.